🚨 Errors, Deprecations & Troubleshooting
Important
Nothing is broken by this card: it only displays entities and never changes your configuration. Please don't delete your dashboards.
Start with what you see:
- The card shows a message: find it under What you see, and what to do.
- The card looks flat, grey or empty: check the same list, then Browser Compatibility.
- A card changed after an update, or the editor shows Migrate config: see Deprecated Options.
- Something else looks wrong: see Other problems.
- You want to report a problem: see Copy the issue report from the card editor.
Sections marked Advanced use the browser console: skip them, or show them to whoever set up your Home Assistant.
Error handling
Not every message means something is broken: the card handles common errors in your configuration or in an entity's state, and says so on the card itself.
What you see, and what to do
entity: Required property is missing.


The card has no entity. Pick one in the editor, or add entity: to the YAML.
decimal: Expected type: positive integer.


An option has a value it can't use (here, a negative decimal). Fix the option
named before the colon.
Not found in HA: entity.


No entity has this ID: a typo, or a removed entity. Check the ID in Settings
➡️ Devices & services ➡️ Entities.
Unavailable


The device or integration behind the entity is offline. The card shows what Home
Assistant reports: check the device or the integration, not the card.
Unknown


The entity exists but has no value yet. Wait for its first value, or check the
integration.
<entity name> unavailable · Unavailable


An entity in min_value or max_value is down: the line names it. Fix that
entity, or use a fixed value.
Div0
min_value and max_value are equal: the bar has no range to fill. Give them
different values.
Custom element doesn't exist: entity-progress-card., in red, instead of
the card
Home Assistant hasn't loaded the card's file: see Card not loading? under
Try common quick checks first.
A Jinja template is a value written between {{ }}; if you never wrote one,
skip this. A Jinja min_value or max_value that fails reads
max_value · JINJA unavailable: see Jinja templates.
When an entity or a Jinja field is unavailable, unknown or not found
A card can depend on several entities (its own entity, an entity in
min_value, max_value, watermark, alert_when, bar_stack) and on Jinja
templates. When one of them cannot give a value, the card does not guess: it
stops drawing what depends on it, and says which one is at fault.
The three states have the same effect:
unavailable: the integration behind the entity is offline.unknown: the entity exists but has no value yet.not found: no entity has this ID in Home Assistant (a typo, or a removed entity).
Required and extra entities
What the bar is drawn from is required: without it, any percentage would be made up. The rest only adds information and is dropped on its own.
| Entity | Role | When it is down |
|---|---|---|
The card's entity |
Required | The bar stops, the state replaces the value |
An entity in min_value or max_value |
Required | The bar stops, the line names the entity |
A Jinja template in min_value or max_value |
Required | The bar stops, the line names the field (see below) |
An entity or template in watermark.low/.high |
Extra | That mark is not drawn, the bar is unchanged |
An entity or template in alert_when.above/.below |
Extra | That threshold is ignored, it cannot trigger the alert |
An entity in bar_stack.entities |
Extra | Left out of the total |
What the card shows
When a required entity is down, the bar stops: 0 %, in the disabled color (the
default color for unknown), and the value is replaced by a line naming the
cause. The icon and the badge show the matching error look.
- The card's own entity: its state, as Home Assistant words it (
Unavailable). - An entity in
min_valueormax_value: its name and state, for examplesensor.limit · Unavailable. - A Jinja template in
min_valueormax_value: the field andJINJA, for examplemax_value · JINJA unavailable.
When several required entities are down at once, the card names the first of
entity, max_value, min_value. Fix it, and the next one shows up if it is
still down.
Jinja templates
A Jinja min_value or max_value can fail in four ways, all shown alike:
- Home Assistant refuses the template (a syntax error, an unknown filter).
- The template has an unclosed delimiter (
{{,{%or{#). It is not even sent to Home Assistant. - Home Assistant reports an error while rendering it.
- It renders something that is not a number, such as
unavailableorunknown(whatstates('sensor.x')returns for an entity that is down).
The line then reads max_value · JINJA unavailable, followed by Home
Assistant's own message instead of unavailable when it gives one. The card
also writes a notice in the browser console, once per template, and again when
the template changes.
Until Home Assistant has answered for the first time, a Jinja range is waiting: the bar is grayed and no value is shown. This is not an error, and it goes away as soon as the template renders a number.
Note
A timer ignores min_value and max_value: it runs on its own duration. They
never put a timer in error.
Find the cause
Advanced: in the browser console,
EPB.doctor.cards() lists the cards on the page. Its entity state column
gives the state and, when it is not the card's own entity, the field at fault:
⏳ unavailable (max_value), or ⏳ unavailable (max_value, Jinja) for a
template. See Run the built-in diagnostic.
Then, in Home Assistant:
- Settings ➡️ Tools ➡️ States: look the entity up. If it is missing, check the ID in the card's YAML.
- Settings ➡️ Tools ➡️ Template: paste the Jinja template. The error shown there is the one the card receives.
- If the entity is
unavailableorunknown, the card shows what Home Assistant reports: fix the integration or the device, not the card.
Deprecated Options
Using an older option? Open the card in the visual editor: if a Migrate config button appears, click it. The card looks the same; only its YAML is rewritten (see How migration works).
What's removed or deprecated
Over time, some configuration options have been deprecated in favor of more flexible or clearer alternatives. While the card tries to maintain backward compatibility, these options may stop working in future releases.
In the development of this card, we strive to avoid breaking changes as much as possible. When such changes are unavoidable, we do our best to support and guide users through the transition.
In this context, we have two types of deprecated options:
- Removed: These were removed to prevent duplication and potential conflicts with the new system. It was important to remove them for stability reasons.
- Deprecated but still active options: These options may have been used in many different cards, and migrating them requires reviewing the configurations of all those cards. Therefore, we allow time before disabling them, provide a system to detect if you are affected, and will remove them later.
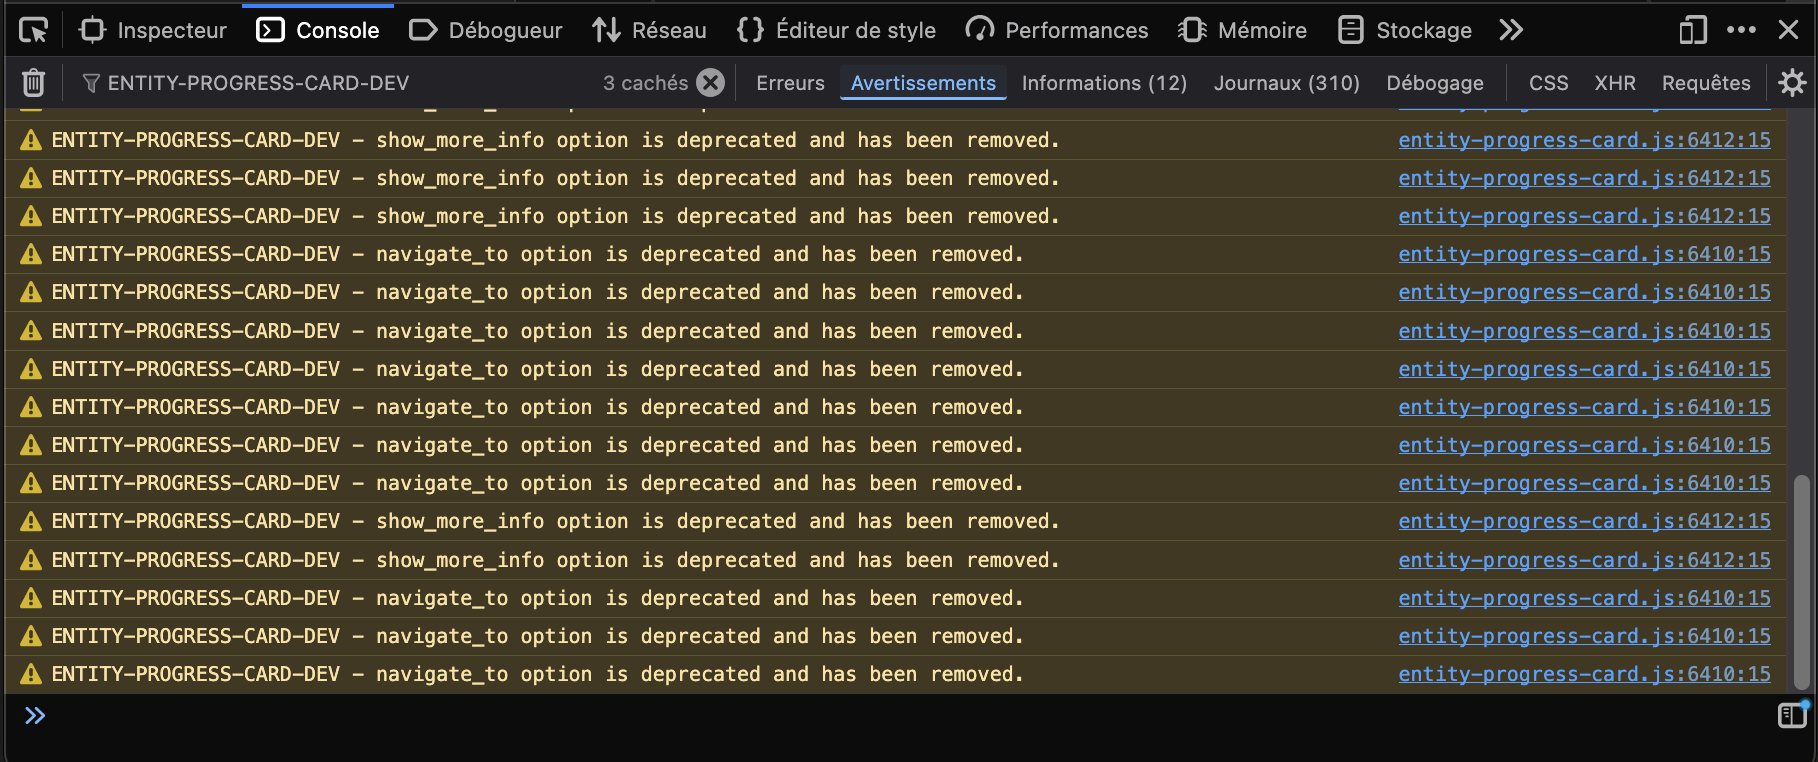
A deprecated option keeps working and writes a warning in the browser console;
most are migrated for the session. A max_value repeating its attribute's own
scale migrates without a warning. A removed option is ignored, with a console
warning.
| Option / Value | Status | Replacement / Recommended Action | Since version |
|---|---|---|---|
navigate_to |
Removed | Use tap_action: navigate |
v1.2.0 |
show_more_info |
Removed | Use tap_action: more-info |
v1.2.0 |
theme: 'battery' |
Deprecated | Use optimal_when_high |
v1.1.7 |
theme: 'cpu' |
Deprecated | Use optimal_when_low |
v1.1.7 |
theme: 'memory' |
Deprecated | Use optimal_when_low |
v1.1.7 |
max_value: <entity id> |
Deprecated | Use max_value: { entity: <id>, attribute: <optional> } |
v1.6.0 |
max_value_attribute |
Deprecated | Fold into max_value: { entity, attribute } |
v1.6.0 |
disable_unit |
Deprecated | Use hide: ['unit', ...] |
v1.6.0 |
icon_animation: none |
Deprecated | Omit the option — unset already means no animation | v1.6.2 |
max_value = the attribute's own scale (255 for a light's brightness, 1 for a volume) |
Deprecated | Omit it — the card already rescales to 0-100 | v1.6.3 |
show_value (Multi-Card / Multi-Feature) |
Deprecated | Use hide: [...] — false adds secondary_info |
v1.6.3 |
value_position (Multi-Card / Multi-Feature) |
Deprecated | Use reverse_secondary_info_row (right → true) |
v1.6.3 |
additions |
Deprecated | Use bar_stack: { mode: 'proportional', entities: [...] } |
v1.6.0 |
watermark.low: <entity id> |
Deprecated | Use watermark.low: { entity: <id>, attribute: <optional> } |
v1.6.0 |
watermark.high: <entity id> |
Deprecated | Use watermark.high: { entity: <id>, attribute: <optional> } |
v1.6.0 |
watermark.low_attribute |
Deprecated | Fold into watermark.low: { entity, attribute } |
v1.6.0 |
watermark.high_attribute |
Deprecated | Fold into watermark.high: { entity, attribute } |
v1.6.0 |
watermark.low_as, low_color, disable_low (and high_*) |
Deprecated | Use watermark.low: { value, as, color }, or false to hide a side |
v1.6.2 |
text_shadow |
Deprecated | Use text_effect: shadow |
v1.6.4 |
Show the console warnings (click to expand)
How migration works
You don't have to rewrite anything by hand:
- Deprecated options (table above) keep working exactly as before — the card understands them internally and applies the modern equivalent automatically, whether or not you ever open the editor.
- Removed options (
navigate_to,show_more_info) have had no effect for a long time already; migrating just cleans them up rather than guessing a replacement for something that hasn't run in years.
When you open the visual editor on a card that still uses a legacy option, a Migrate config button appears in the top-right corner. One click rewrites your YAML to the current syntax — the rendered card doesn't change, only how it's written. If you already wrote the new option next to the old one, the new one is what counts: the old one is simply removed.
The same button shows up for an option that has no effect where it is set —
text_effect on a bar that isn't overlay or background, a bar_color_mode
without a theme. The click takes it out of your YAML; undo the change that made
it pointless while the editor is still open, and it comes back as it was.
To find every card that needs it, on every dashboard — views you never open included — run this in the browser console on any dashboard:
EPB.doctor.audit();
It lists each card with its deprecated options and those without effect, and Multi cards whose rows switched to the 1.6.3 look (icon, name and value) because their config never said otherwise.
As with any edit: check that the card still looks right, and that the values it displays match what you expect, before saving the dashboard.
Other problems
Browser Compatibility
Some issues aren't a bug — the browser is simply below the supported version.
The card needs Home Assistant 2024.0 or newer, and Chrome or Edge 98+, Firefox 94+, Safari 15.4+ or Opera 84+. A few decorative touches (icon tint, alert/ping pulse, bar gradient sheen) need newer versions; on older browsers they are simply not shown, and the values stay the same. Is your browser too old? See the compatibility table and the graphic effects compatibility overview.
- Older Chromium (e.g. Chrome 92, common on wall-mounted tablets): the card loads and works (see issue #128). We do our best to keep it compatible, though a few details may look slightly different.
Quick checks and reporting
Try common quick checks first
- Already on the latest version?
Fix: check your installed version against the latest release — the Marketplace (HACS before Home Assistant 2026.11) flags an update under Settings ➡️ Updates when one is available. It can lag before it shows a new release though: if your version looks outdated but no update is offered, go to Settings ➡️ Marketplace, search for the card, then ⋮ ➡️ Install another version to install the current release rather than waiting. - A pre-release (RC) already fixes it?
Fix: patches and new features often ship first as a release candidate (x.y.z-rcN) before the stable release. Check all releases (includes pre-releases) — your issue may already be fixed there. To try one, see Testing a Release Candidate. - Card not loading?
Fix: check that the card is listed in Settings ➡️ Dashboards ➡️ ⋮ ➡️ Resources, with the type JavaScript Module. No Resources entry? Turn on Advanced mode in your user profile, or ask whoever set up Home Assistant. - The Marketplace not detecting the card?
Fix: try clearing your browser cache or restarting Home Assistant. - Card missing gradients/pulse animations, or looks a bit flat?
Fix: likely just an older browser — see Browser Compatibility above. - Card not rendering, a
Cannot use 'import.meta' outside a moduleerror, or pop-ups (e.g. browser_mod) freezing?
Cause: your resource is registered as a classic "JavaScript" type (deprecated by Home Assistant) instead of "JavaScript Module". HA loads classic scripts differently, and older builds couldn't survive it — the card failed to load and could freeze browser_mod pop-ups (see issue #108). Fix: in Settings ➡️ Dashboards ➡️ ⋮ ➡️ Resources, open the entry, set Resource type → JavaScript Module, then hard-refresh (reload without the cache:Ctrl/Cmd+Shift+R). This changes only that entry, not your dashboards. (Recent builds load correctly either way and print a console warning when they detect the classic type.) - The visual editor doesn't open — Home Assistant shows its YAML editor
instead?
Fix: the editor ships beside the card inentity-progress-card-editor.js, and loads the first time you open one. A manual install needs that file next toentity-progress-card.js; the console says why it didn't load (Visual editor unavailable: …). Right after an update, hard-refresh: a card still cached from the previous version refuses the new editor. - Still not working?
Fix: look for errors in the browser console.
Open the browser console
Advanced. Press F12 (Mac: ⌘ + ⌥ + I), then open the
Console tab. Safari needs its Develop menu first: see below.
Each browser, step by step (click to expand)
Firefox
- Keyboard:
F12orCtrl+Shift+K(Mac:⌘+⌥+K) - Menu: the
≡menu (top-right) ➡️ Web Developer ➡️ Web Console
Chrome / Chromium
- Keyboard:
F12orCtrl+Shift+J(Mac:⌘+⌥+J) - Menu: the
⋮menu (top-right) ➡️ More tools ➡️ Developer tools, then the Console tab
Safari
- Keyboard:
⌘+⌥+C - Menu: enable the Develop menu first, in Safari ➡️ Preferences ➡️ Advanced ➡️ Show Develop menu in menu bar; then Develop ➡️ Show JavaScript Console
Opera
- Keyboard:
Ctrl+Shift+I(Mac:⌘+⌥+I) - Menu: the O menu (top-left) ➡️ Developer ➡️ Developer tools, then the Console tab
Edge
- Keyboard:
F12orCtrl+Shift+I(Mac:⌘+⌥+I) - Menu: the
⋯menu (top-right) ➡️ More tools ➡️ Developer tools, then the Console tab
Copy the issue report from the card editor
The quickest way: open the card in the visual editor and click the bug icon in
its top-left corner. It copies a report ready to paste into your issue — the
diagnostic below, then the card's YAML with its deprecated options and options
without effect marked, and a # drawn from: comment with the range and value
the bar is drawn from. On a Multi card, use the icon on the card itself, not on
one of its rows. The issue will be public: read the report before posting it.
Run the built-in diagnostic
Advanced. The card ships with a small diagnostic helper that collects the same information in one shot. Open the browser console on any dashboard, and run:
EPB.doctor.dump();
Note
On a development build the helper answers to EPB_DEV instead, and on a copy
loaded with ?suffix=rc to EPB_RC: each copy keeps its own. EPB.help()
lists every command; the former EPB_DIAG.dump() still works.
To look at one card in particular:
| Command | What it shows |
|---|---|
EPB.doctor.cards() |
The cards on the page, numbered, each with a config state (✅ ok, ❌ invalid, ⚠️ deprecated, 🧹 no effect, 🎨 new look), an entity state (✅ ok, ⏳ unavailable, ❓ unknown, 🚫 not found), the findings in details and a drawn line (min 0 · max 100 · value 42 · 42%) |
EPB.doctor.inspect(2) |
Card 2: the value and the range its bar is drawn from, and the config it ended up with; EPB.doctor.inspect($0) takes the card picked in the DevTools' Elements tab |
EPB.doctor.jinja(2) |
Card 2's Jinja fields, each with Home Assistant's last result or error |
EPB.doctor.history(2) |
The samples behind card 2's trend_indicator and peak_marker |
EPB.doctor.copy(2) |
An issue report for card 2, the same as the editor's bug icon, copied when the browser allows (otherwise run copy($_) right after) |
EPB.doctor.dump() prints an anonymized report — card and Home Assistant
versions, browser, dark mode / reduced motion status, registered card types,
whether the required HA components (ha-card, ha-selector, action-handler)
are present, and where the visual editor is loaded from and whether it loaded —
ready to copy/paste into your issue. Chrome, Edge and Opera only give their
exact version and operating system over HTTPS; elsewhere, the user agent line is
all there is.
It also flags a duplicate resource load on its own
(duplicate load: ⚠️ YES, followed by the URLs loaded) — a common,
hard-to-diagnose cause of erratic behavior where the card ends up installed
twice (e.g. via the Marketplace and a leftover manual resource in
Settings ➡️ Dashboards ➡️ ⋮ ➡️ Resources). If you see this
warning, remove the extra resource entry first — it resolves most "impossible to
reproduce" issues on its own.
The sha-256 lines give the first 12 characters of the card and editor files as
your browser received them: compare them with the sha256: digest GitHub shows
beside each file of the release to make sure you run the published one. They
need HTTPS.
Enable debug logging (?debug=…)
Advanced. For harder cases, the card can print detailed per-area logs to the
browser console — no special build required. Open the card's entry in
Settings ➡️ Dashboards ➡️ ⋮ ➡️ Resources, keep its URL as it is
and add ?debug=… at the end (&debug=… when the URL already has a ?), e.g.:
/local/community/lovelace-entity-progress-card/entity-progress-card.js?debug=card,registration
Reload the page (a hard refresh, Ctrl/Cmd + Shift + R). A console
warning confirms which areas are active. Available areas (comma-separated, or
all):
| Area | What it logs |
|---|---|
card |
Card lifecycle — connect / disconnect / document move / config / refresh, with timing |
registration |
Custom-element registration order, duplicates, and card-picker entries |
instances |
A per-class object-creation counter (spot leaks / over-rendering) |
interference |
When another module changes this card's host element from outside |
editor |
The visual editor: config in, config-changed out |
interactionHandler |
tap / hold / double-tap action resolution |
hass |
First hass, HA core version, language changes |
ressourceManager |
Timers / listeners / template subscriptions (spelled as in the code) |
For a card that misbehaves only when other cards/modules are present,
?debug=card,registration,interference is the most useful combination — it
shows lifecycle churn, registration problems, and outside interference at once.
Copy the console output into your issue.
Without access to the resource URL, EPB.debug('card,registration') in the
console keeps the same areas on in this browser, across reloads; reload the page
to apply it, and run EPB.debug(false) to turn them off. EPB.debug() shows
what is saved.
Note
?debug=… and EPB.debug() only turn logging on — they change nothing else.
Remove the query, or run EPB.debug(false), once you're done.
Or gather the information by hand
If neither the editor nor the console is at hand, note:
- Home Assistant version
- Browser used
- YAML configuration snippets (if relevant)
- Any visible error messages (from the console or logs)
Open an issue on GitHub
You don’t need to be a developer to report an issue! Whether you're a beginner or an advanced user, your feedback is valuable!
- Before creating a new issue, please first check existing issues to see if the problem has already been reported.
- If not, feel free to submit a new issue with all the relevant information. You need a free GitHub account.
Note
When opening an issue, try to include as much information as possible.
The more context you provide, the faster and more accurately we can help - we’ll troubleshoot it together!
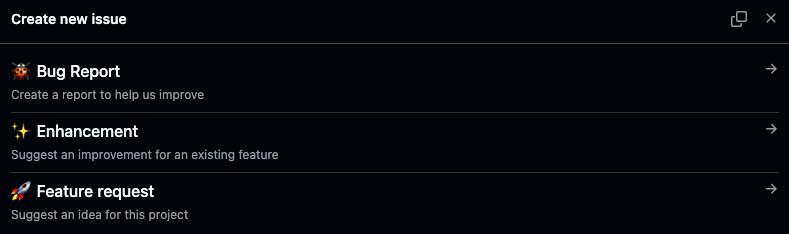
To help you out, we’ve set up a simple system that asks you the right questions and guides you through the process of creating a useful issue.
Show the issue choices (click to expand)
Roll back
If you recently updated the card and the issue started afterward, first open an issue on GitHub so the problem gets fixed in the next release. Meanwhile, go to Settings ➡️ Marketplace, search for the card, then ⋮ ➡️ Install another version, and pick the previous one.
Your dashboards stay intact.